Crime taxonomy · Words and context
Misleading title, labels or annotation
A title or annotation that says something the data does not.
What it looks like
The headline contradicts or overstates the chart, series are mislabelled, legends swapped, or units are wrong or missing.
Example
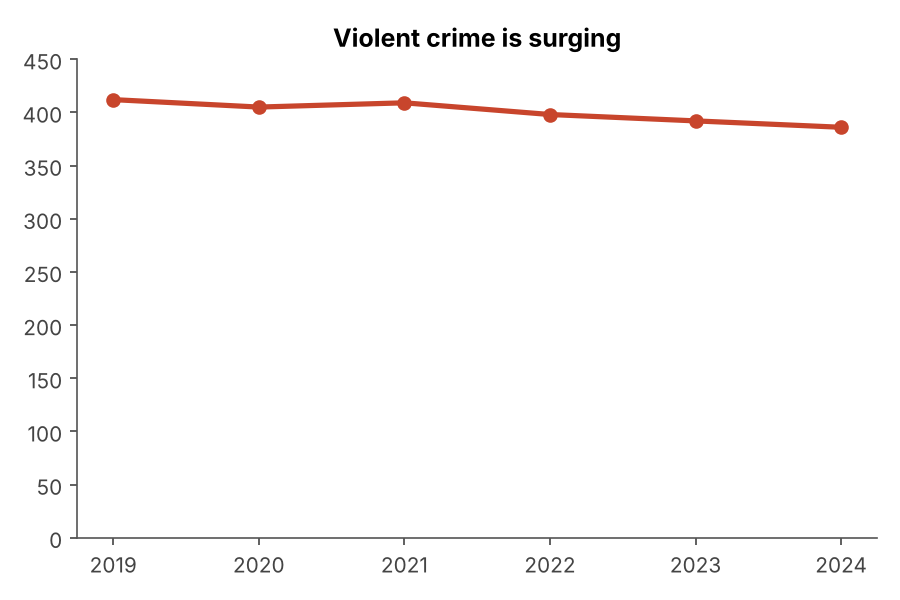 MISLEADING LABELS
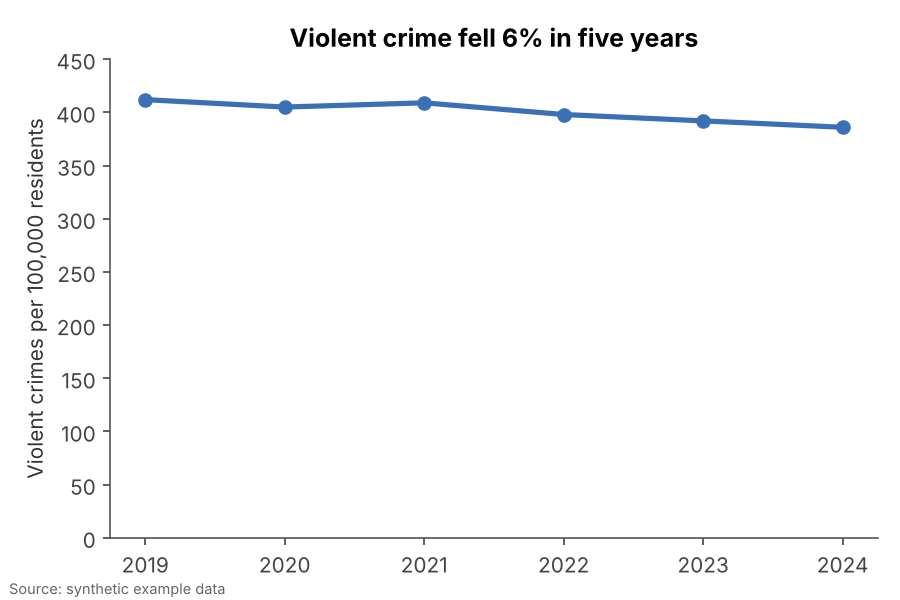 FIXED
FIXEDWhy it is bad
- The title is read first and frames everything else. Many readers never check it against the data.
- It is the cheapest manipulation: the chart can be flawless while the words do the lying.
- AI-generated captions are especially prone to confident overstatement.
How to fix it
- Write titles that state the finding the data supports, with the size of the change.
- Check every label, legend entry and unit against the source.
- Prefer "rose 3%" over "soared": let the number carry the weight.
When it is not a crime. Opinionated titles are fine when the data backs them up. "Crime fell sharply" over a 40% drop is accurate.