Crime taxonomy · Drawing and geometry
Part-to-whole error
Pies and stacks whose parts do not add up to the whole.
What it looks like
A pie chart or 100% stacked chart whose percentages sum to more or less than 100%, or that shows overlapping categories ("pick all that apply") as if they were exclusive.
Example
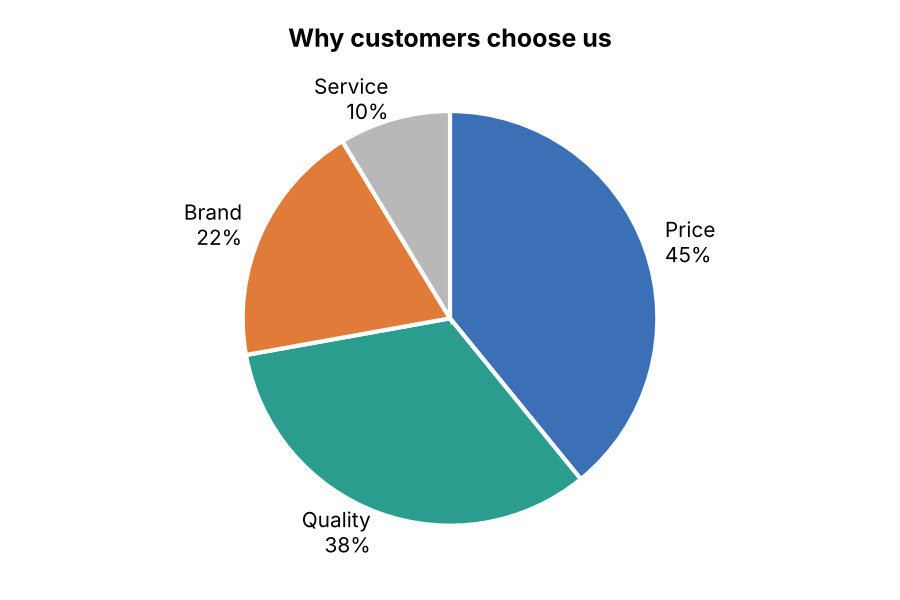 BROKEN WHOLE
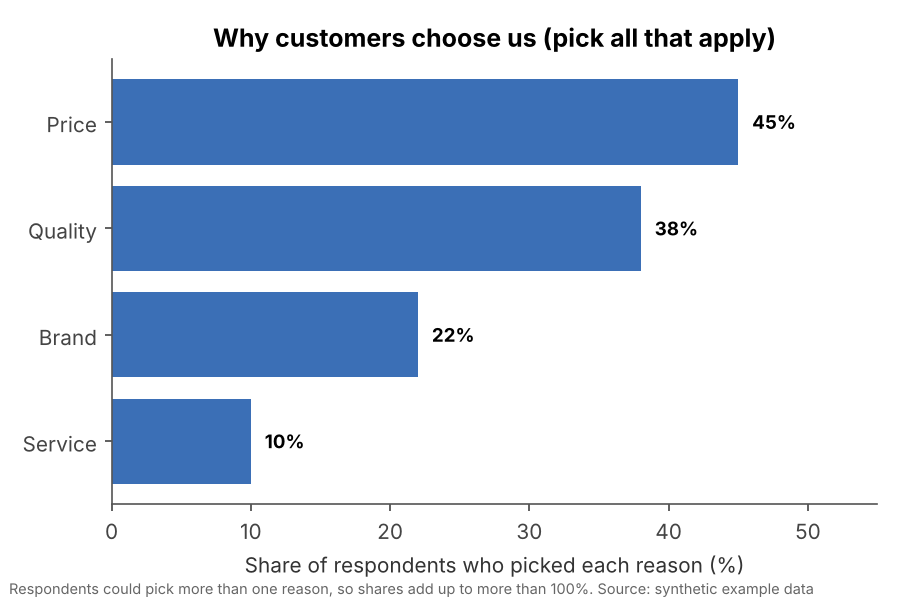 FIXED
FIXEDWhy it is bad
- A pie promises a complete, exclusive split. When the parts sum to 115%, every slice is drawn wrong.
- The software silently rescales the slices, so the drawing contradicts the labels.
- Overlapping answers shown as a split hide the fact that most people chose several.
How to fix it
- Only use pies and 100% stacks for parts that are exclusive and add up to the whole.
- Use bars for multiple-choice or overlapping categories, and say that totals exceed 100%.
- Check the sum. Rounding to 99% or 101% is fine; 115% is not.
When it is not a crime. Sums of 99% or 101% from rounding are normal; a footnote saying so is a nice touch.