Crime taxonomy · Words and context
Incorrect or unsubstantiated attribution
Crediting a change to a cause the chart cannot prove.
What it looks like
A title, caption or annotation says a policy, leader, product or event caused the change shown, but the chart cannot support it: the change started before the cause, there is no comparison group, or other obvious drivers are ignored. It also covers a cited source that could not have produced the data shown.
Example
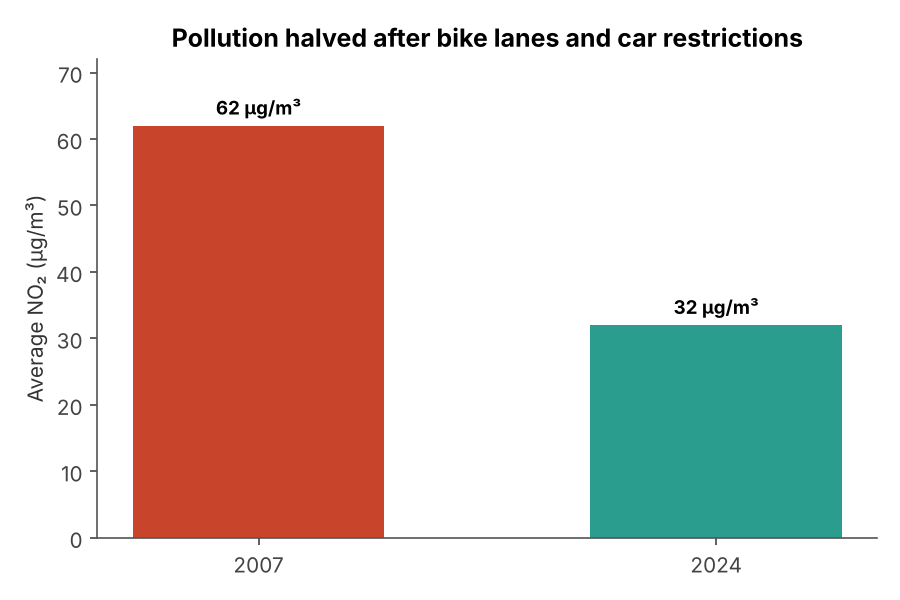 UNPROVEN CAUSE
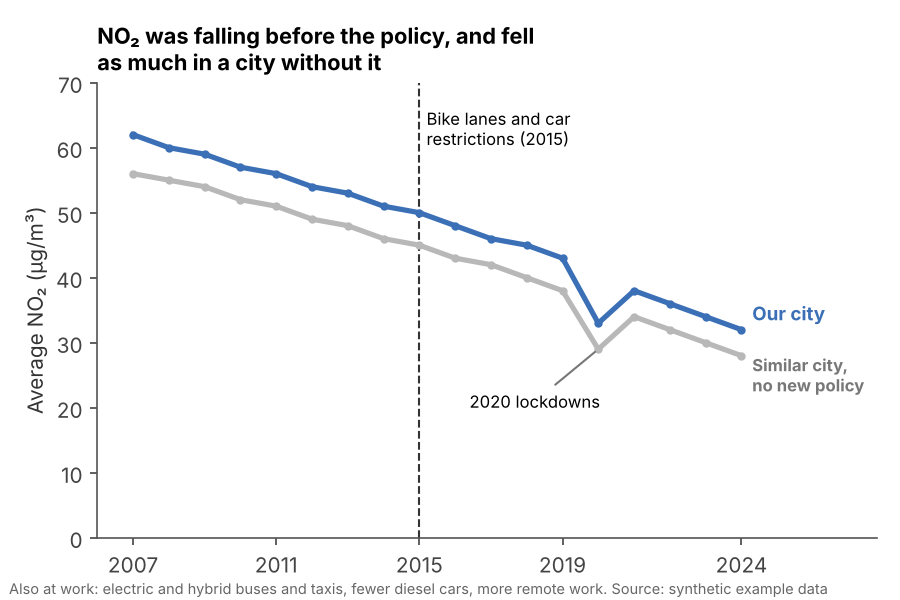 FIXED
FIXEDWhy it is bad
- A chart shows that something changed, not why. The caption quietly adds a causal claim the data never tested.
- Long-running trends get claimed by whoever was in charge at the end of them.
- A credible source name lends authority to a conclusion that source may never have drawn.
- A typical example: maps of falling NO₂ in a city captioned as the result of bike lanes and car restrictions, ignoring that buses and taxis switched to electric or hybrid, cars moved away from diesel (the main NO₂ source), and post-pandemic remote work cut the number of trips.
How to fix it
- Describe what changed, and claim a cause only when the evidence supports it.
- Show the trend before the cause, so readers can see whether it changed course.
- Add a comparison: a similar place, group or period without the policy or event.
- Name the other drivers (technology, the economy, a pandemic, a new measurement method) and say how they were accounted for.
- Quote what the cited source actually concluded, and link to it.
When it is not a crime. Causal titles are fine when the evidence is there, such as a controlled study, a clear break in the trend at the moment of the cause, or a comparison group that did not change.