Crime taxonomy · Drawing and geometry
Area, volume or 3D distortion
Scaling icons, bubbles or 3D shapes so a doubling looks like a quadrupling.
What it looks like
A one-dimensional value is shown by a shape whose width and height (or volume) are both scaled, or by 3D perspective that makes nearer slices and bars look bigger.
Example
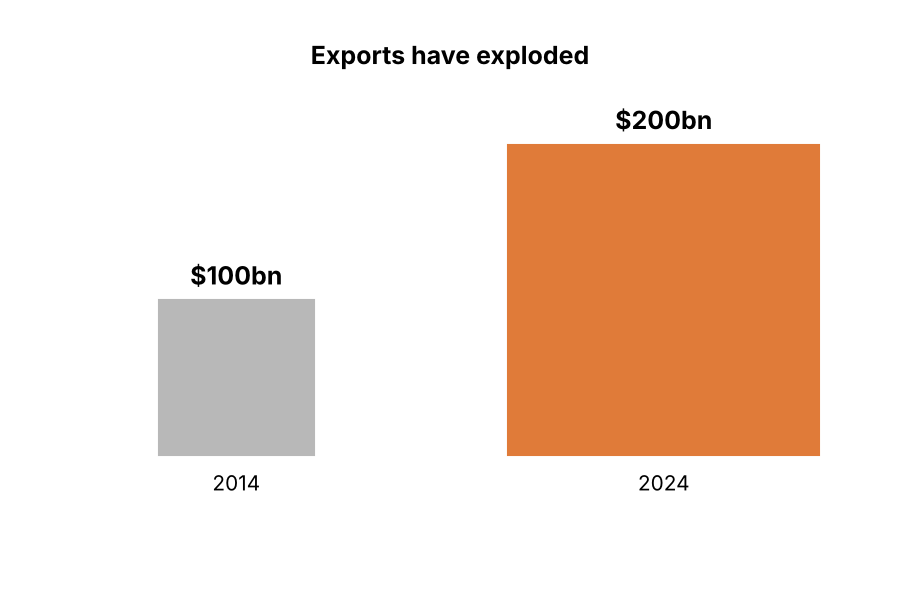 3D DISTORTION
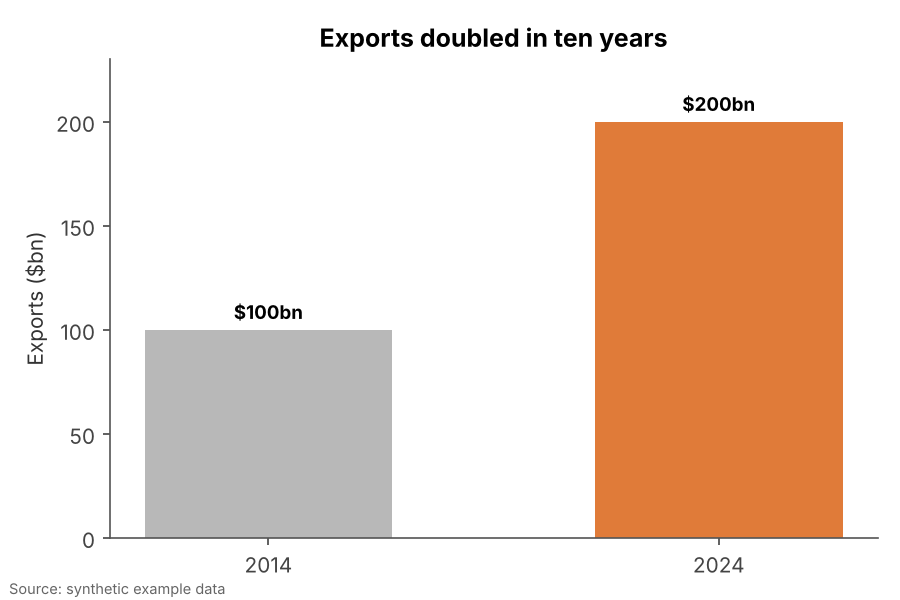 FIXED
FIXEDWhy it is bad
- Double the side of a square and its area quadruples. Readers judge area, not side length.
- 3D perspective makes the slice or bar closest to the viewer look larger than its value.
- Pictograms feel friendly and harmless, which makes the exaggeration easy to miss.
How to fix it
- Use length (bars, dots on a common scale) for single values.
- If you use bubbles or icons, scale their area, not their radius or height.
- Drop 3D effects. They add no information and always distort.
When it is not a crime. Bubble charts are fine when bubble area, not radius, is proportional to the value and a size legend is shown.