Crime taxonomy · Axes and scales
Manipulated axis scale
Uneven, inverted or hidden scales that bend the trend.
What it looks like
The ticks are spaced evenly while the values they mark are not, the axis is flipped so down means up, a log scale is used without saying so, or the range is picked to flatten or steepen a trend.
Example
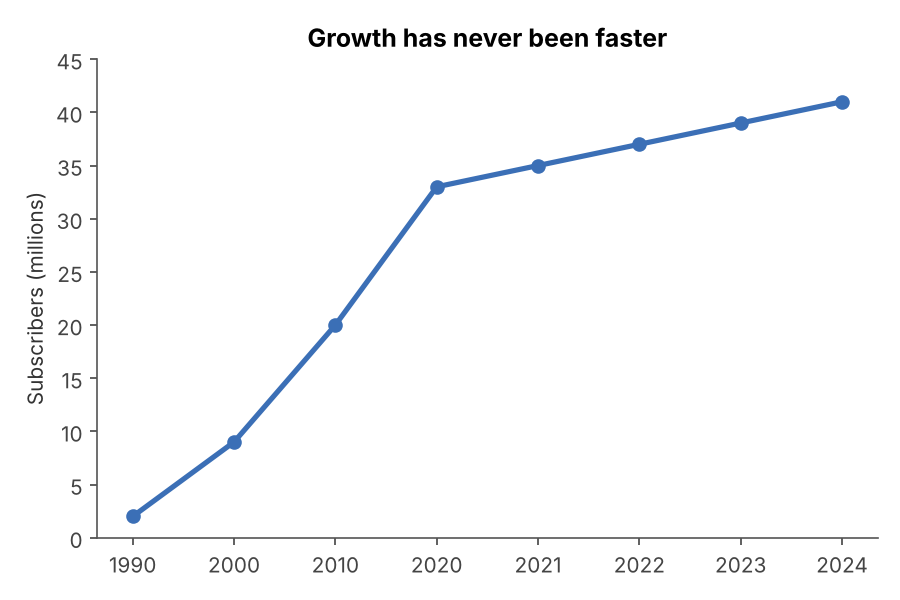 RIGGED SCALE
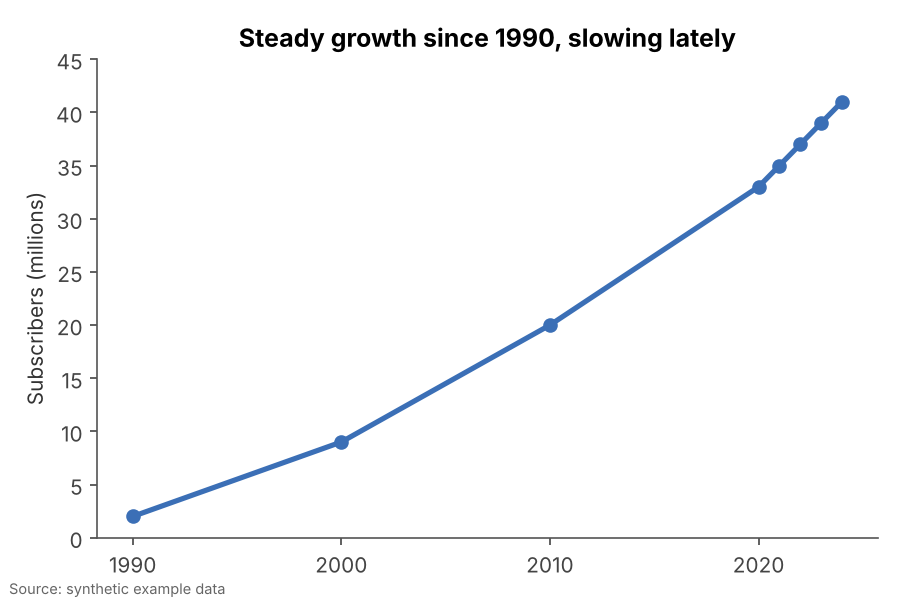 FIXED
FIXEDWhy it is bad
- Readers assume equal distances on an axis mean equal amounts. Uneven intervals silently compress or stretch the story.
- An inverted axis turns a rise into a fall for anyone who does not read the labels carefully.
- An unlabelled log scale makes exponential growth look tame, or tame growth look explosive.
How to fix it
- Use a continuous axis with evenly spaced, evenly valued ticks.
- Keep up as more and right as later unless there is a strong convention otherwise, and label any exception.
- When a log scale is the right tool, say so in the axis label ("log scale").
When it is not a crime. Log scales are honest and useful for data spanning orders of magnitude, as long as they are labelled.