Crime taxonomy · Data selection
Outlier reference point
Measuring change from an abnormal year, like the 2020 lockdowns.
What it looks like
Growth or decline is computed against a period that was anything but normal: a pandemic trough, a one-off boom, a record year, or an index set to 100 at an extreme point.
Example
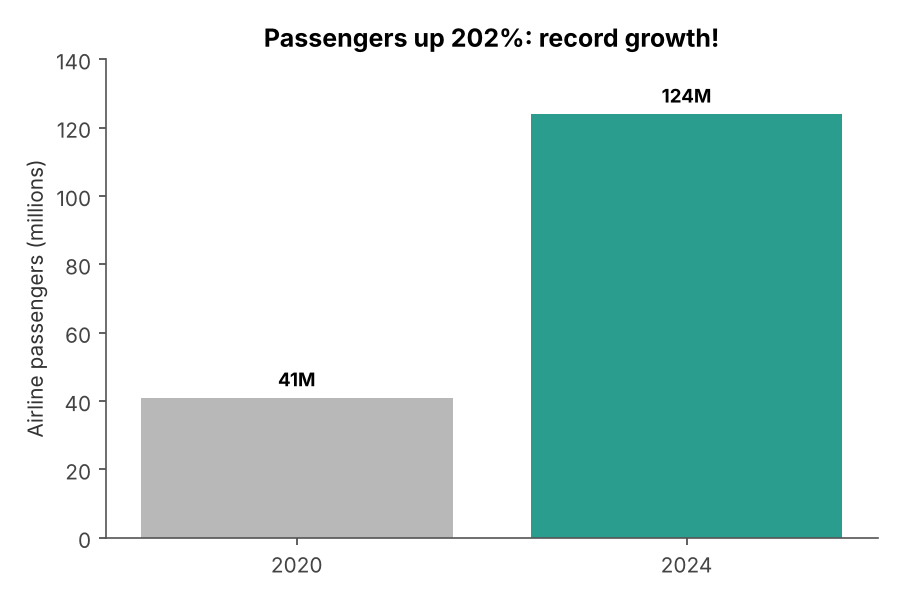 OUTLIER BASELINE
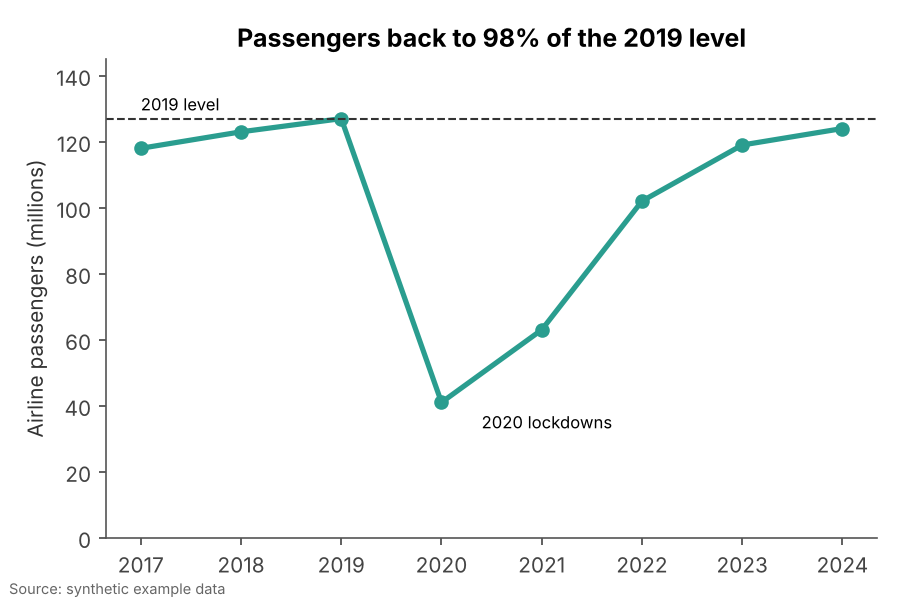 FIXED
FIXEDWhy it is bad
- Recovering from a crash looks like record growth if the crash is the starting point.
- A slight dip from a record year can be sold as a collapse.
- Percent-change headlines rarely show the baseline year, so readers cannot tell it was unusual.
How to fix it
- Compare against a normal period (e.g. 2019 for pandemic-era data) or a multi-year average.
- Show the full series so the anomaly is visible, and label it.
- State both numbers: change since the anomaly and change since the last normal year.
When it is not a crime. Measuring from an anomaly is fine when the anomaly is the subject, such as recovery since a disaster, and it is labelled as such.