Crime taxonomy
The chart crime taxonomy
Every chart Chart Police inspects is checked against these 16 crimes, in five families. Some are honest mistakes, some are deliberate; both mislead. Each page explains the crime, why it is bad, shows an example and its fix, and says when the same technique is perfectly legitimate.
Axes and scales
Bending the ruler the data is measured against.
 TRUNCATED AXIS
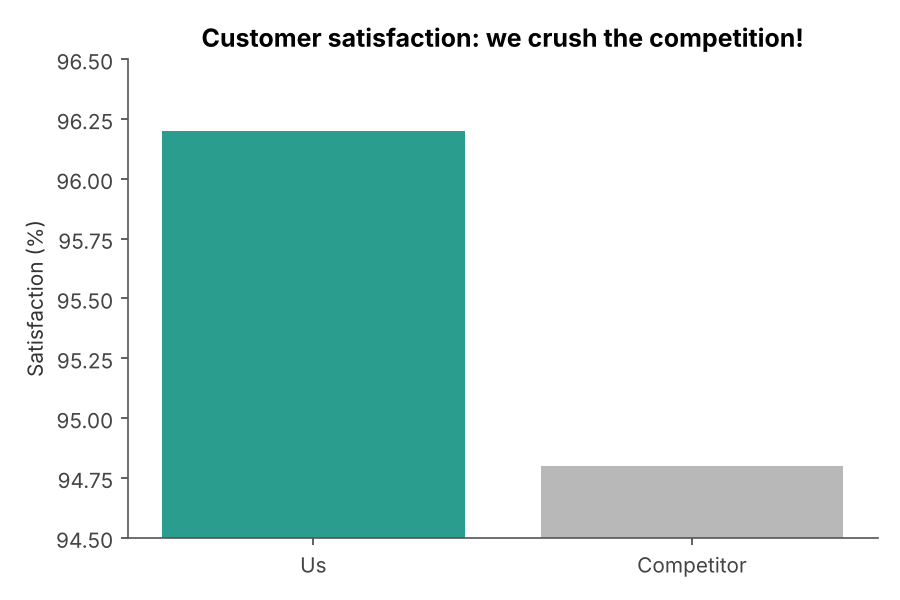
Truncated or non-zero baseline
Cutting off the bottom of a bar chart so small differences look huge.
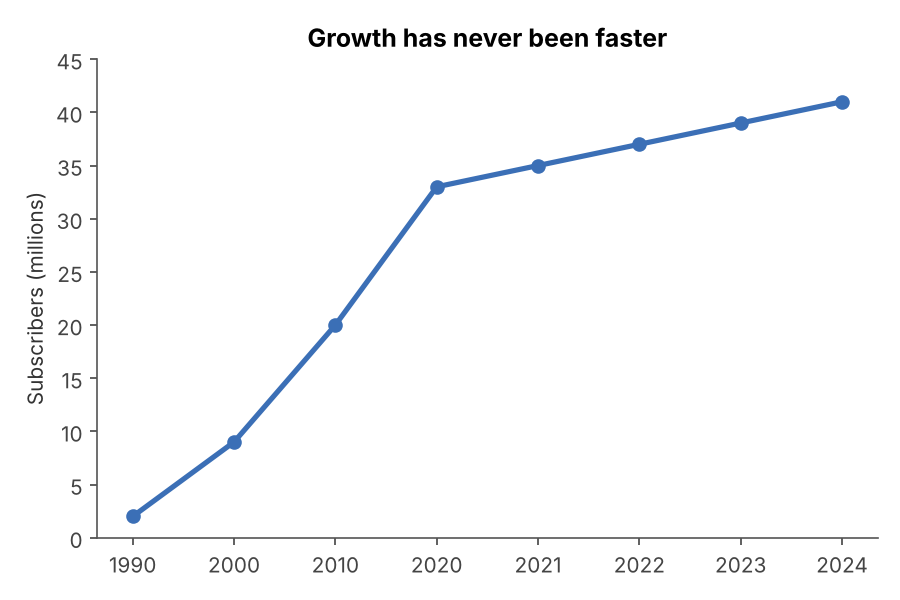 RIGGED SCALE
Manipulated axis scale
Uneven, inverted or hidden scales that bend the trend.
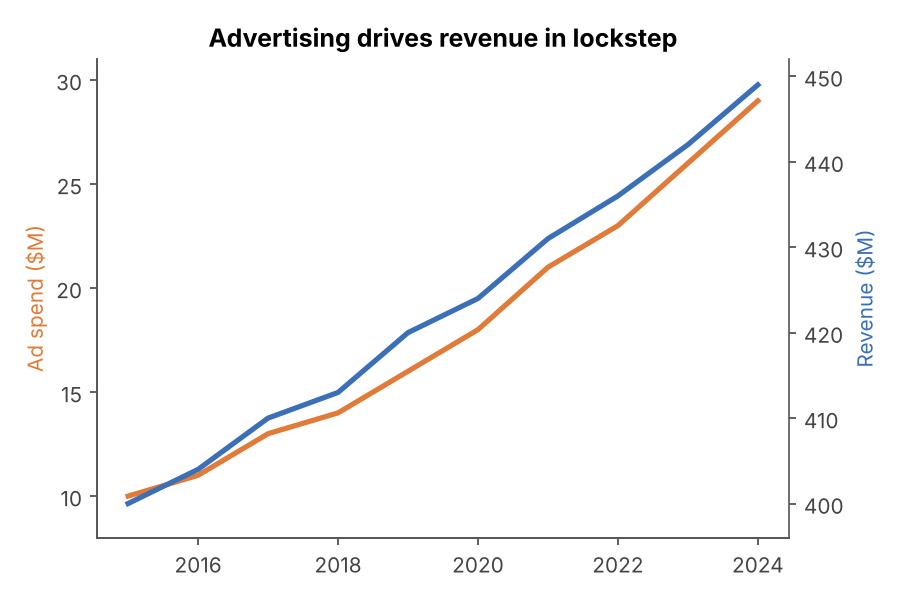 DUAL-AXIS ABUSE
Dual-axis distortion
Two series on two independent axes, scaled to tell whatever story you like.
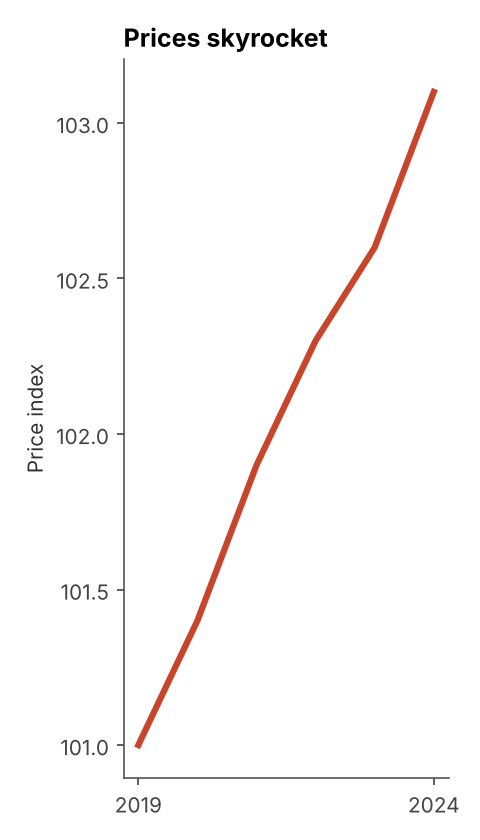 STRETCHED CHART
Aspect ratio stretching
Squashing or stretching the chart until the slope says what you want.
Drawing and geometry
Shapes that do not match the numbers they stand for.
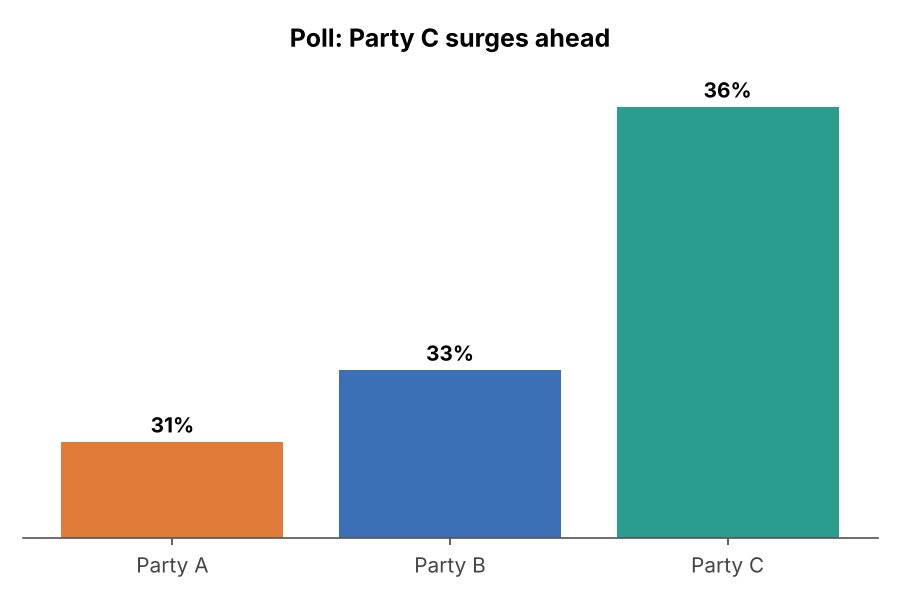 FAKE PROPORTIONS
Visual does not match the data
The picture disagrees with the numbers printed on it.
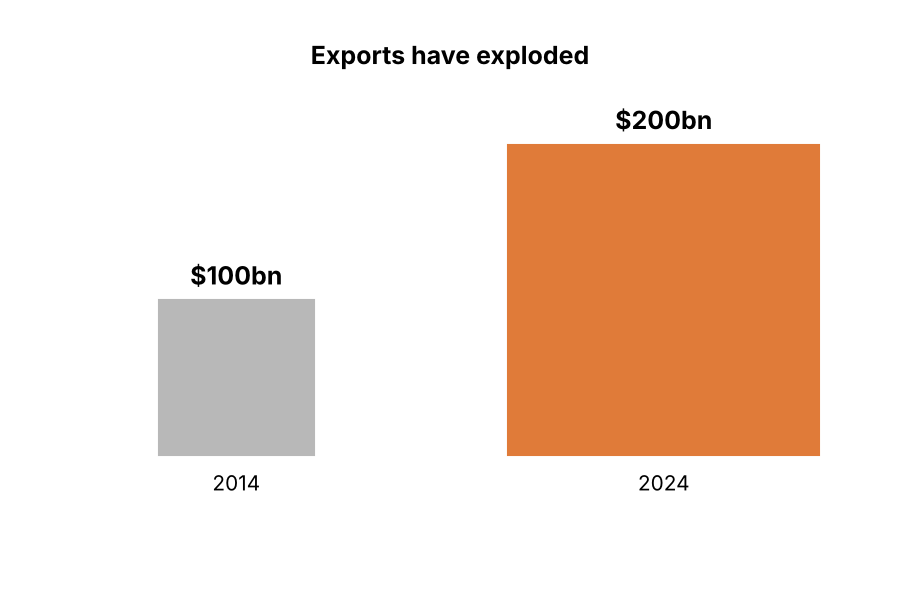 3D DISTORTION
Area, volume or 3D distortion
Scaling icons, bubbles or 3D shapes so a doubling looks like a quadrupling.
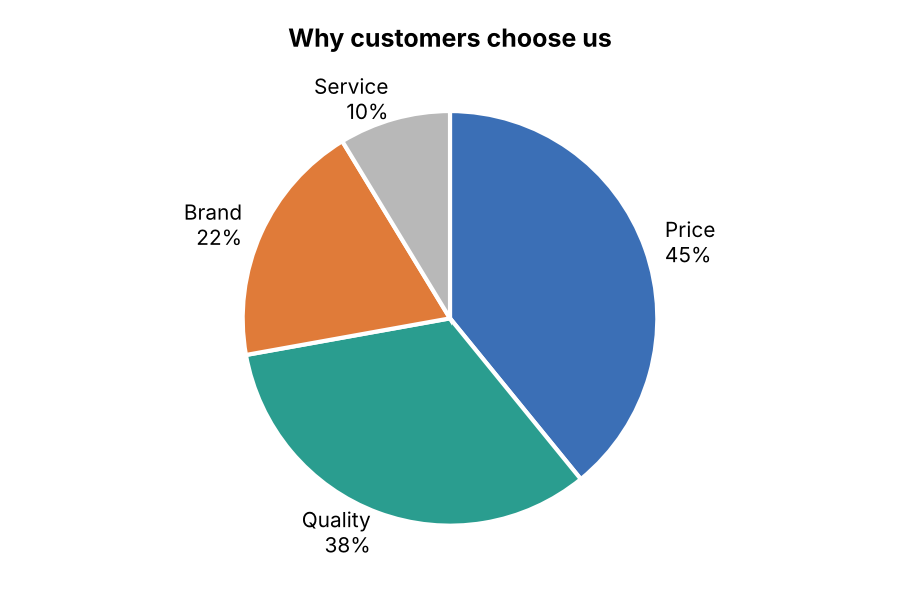 BROKEN WHOLE
Part-to-whole error
Pies and stacks whose parts do not add up to the whole.
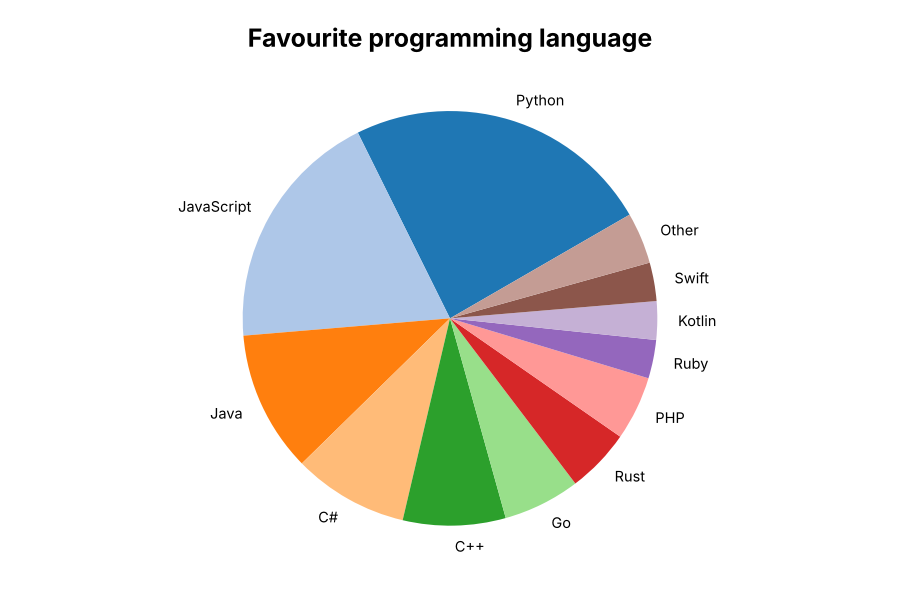 WRONG CHART TYPE
Inappropriate chart type or encoding
A chart type that hides the comparison it is supposed to show.
Data selection
Choosing which data the reader gets to see.
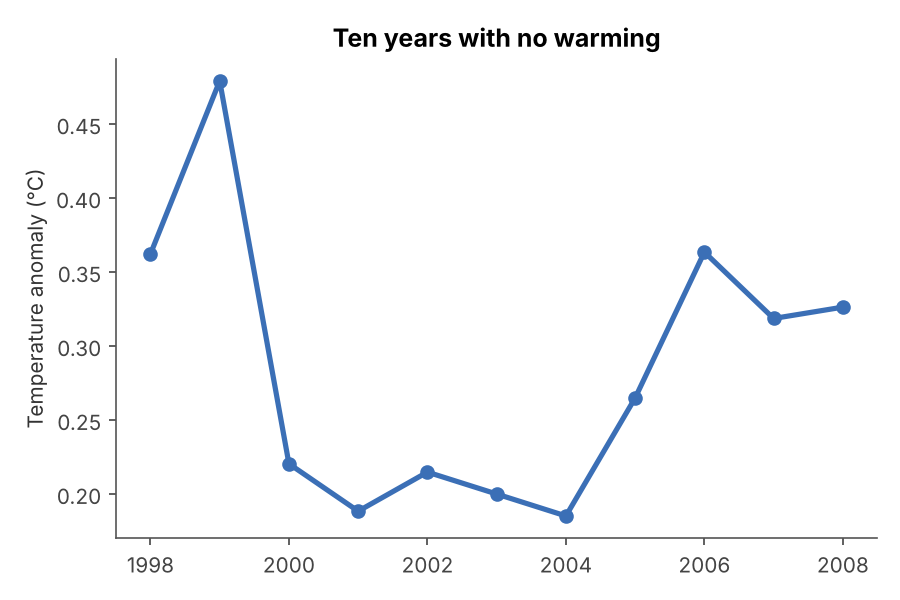
Words and context
Titles, labels and missing information that steer the reading.
 MISLEADING LABELS
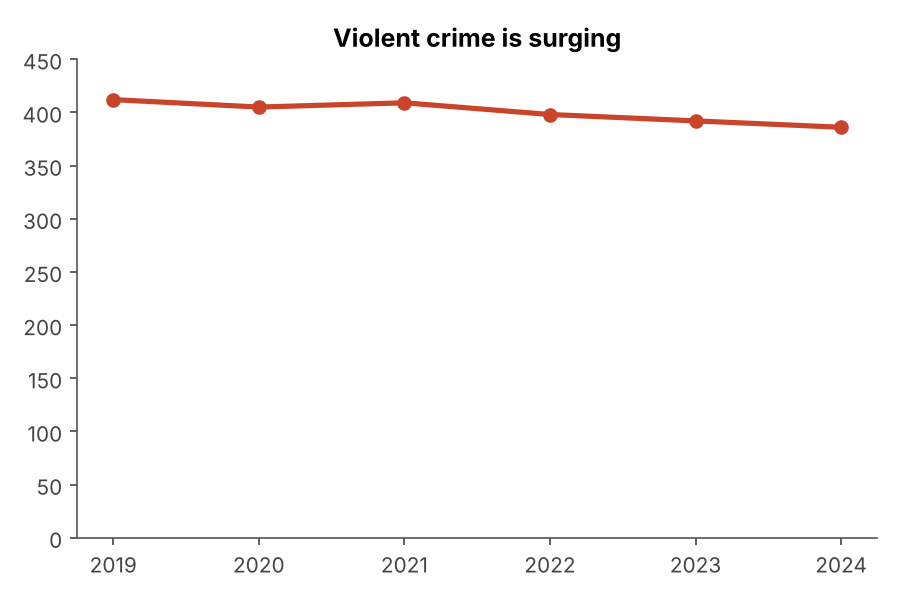
Misleading title, labels or annotation
A title or annotation that says something the data does not.
 UNPROVEN CAUSE
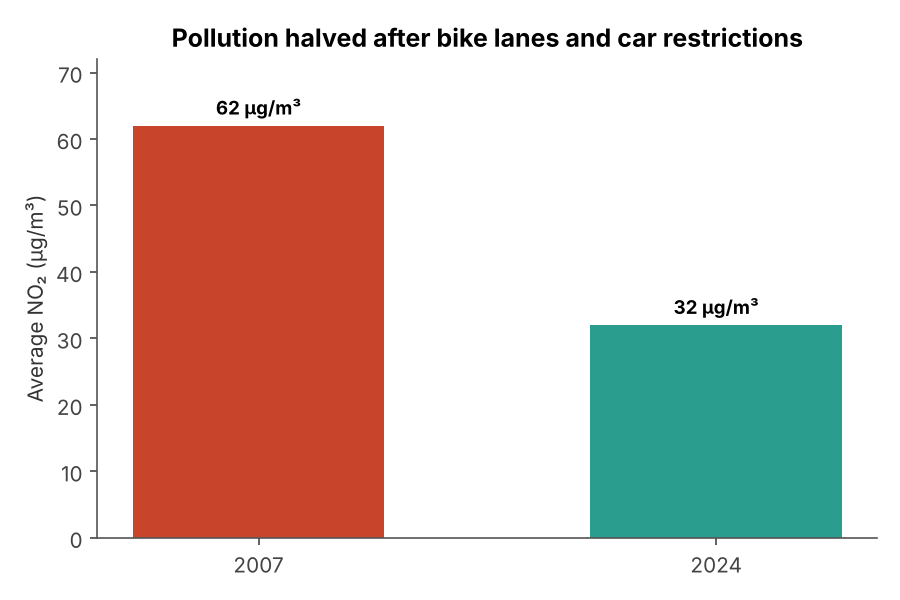
Incorrect or unsubstantiated attribution
Crediting a change to a cause the chart cannot prove.
 MISSING CONTEXT
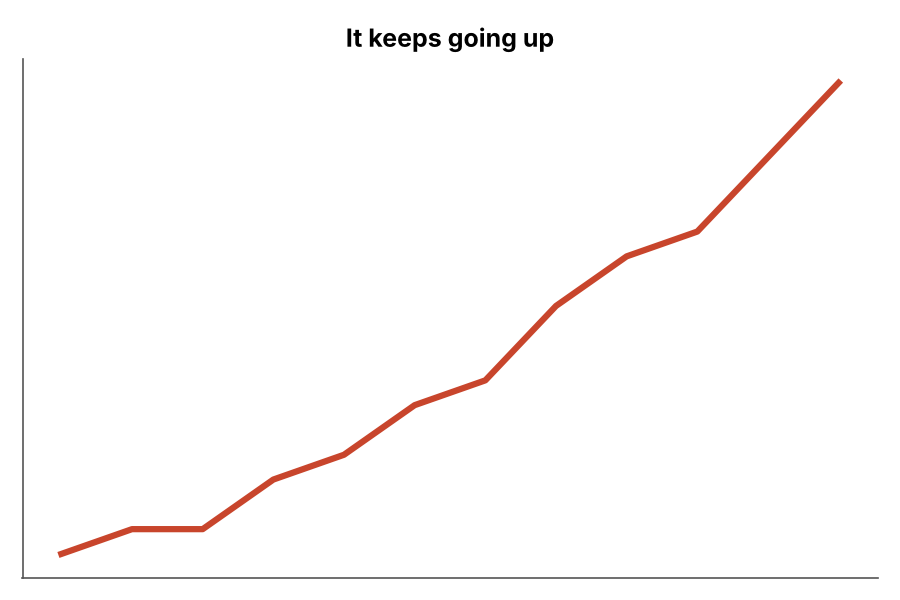
Missing context
No axes, no units, no source, nothing to compare against.
Maps and colour
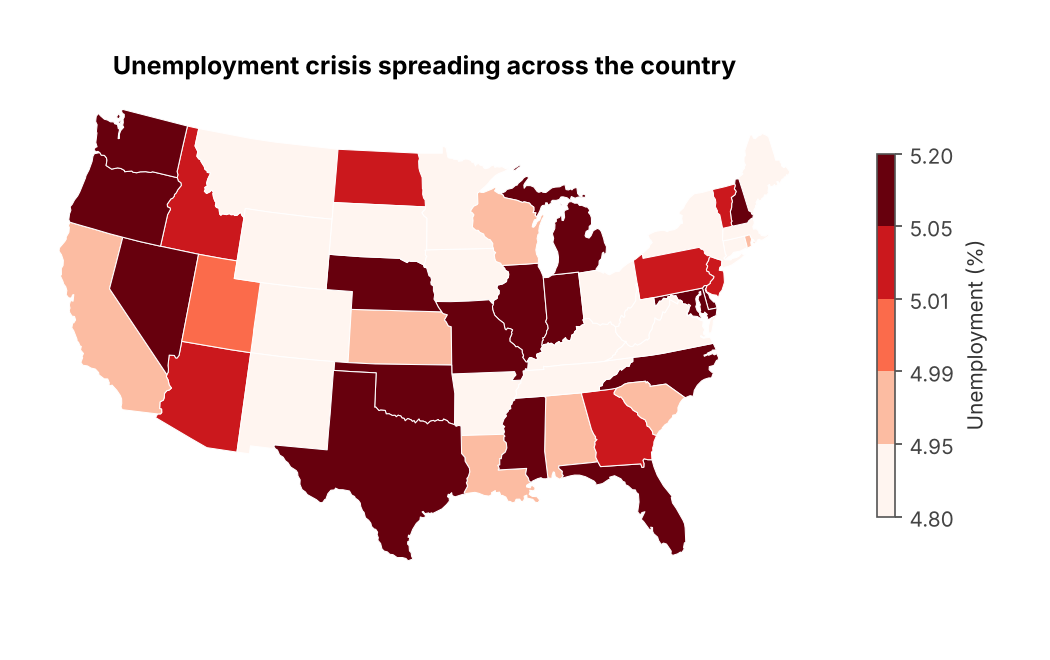
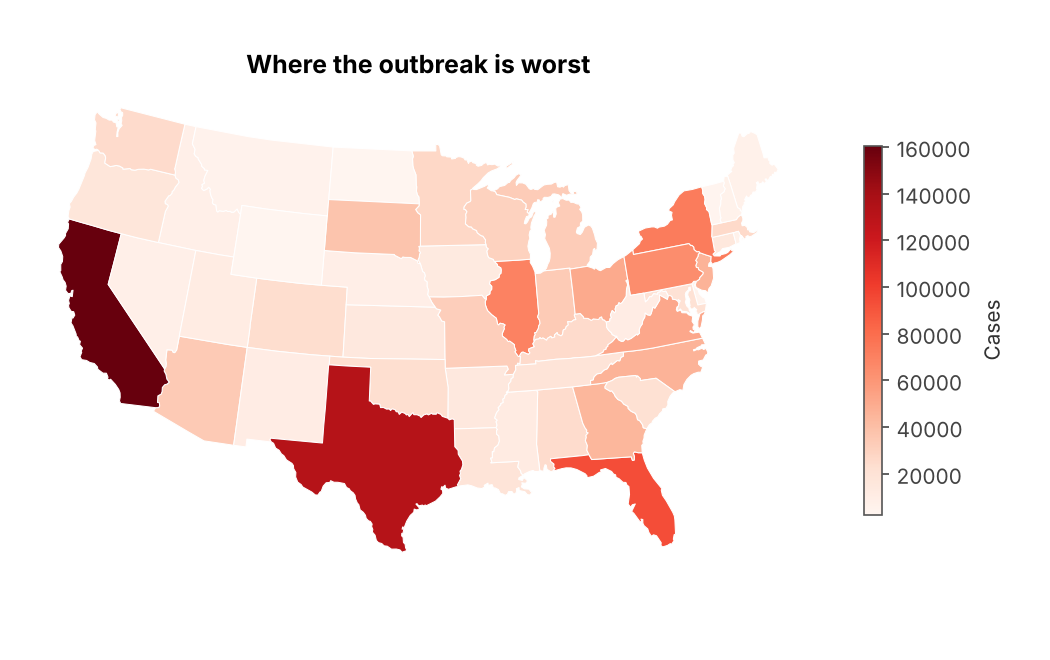
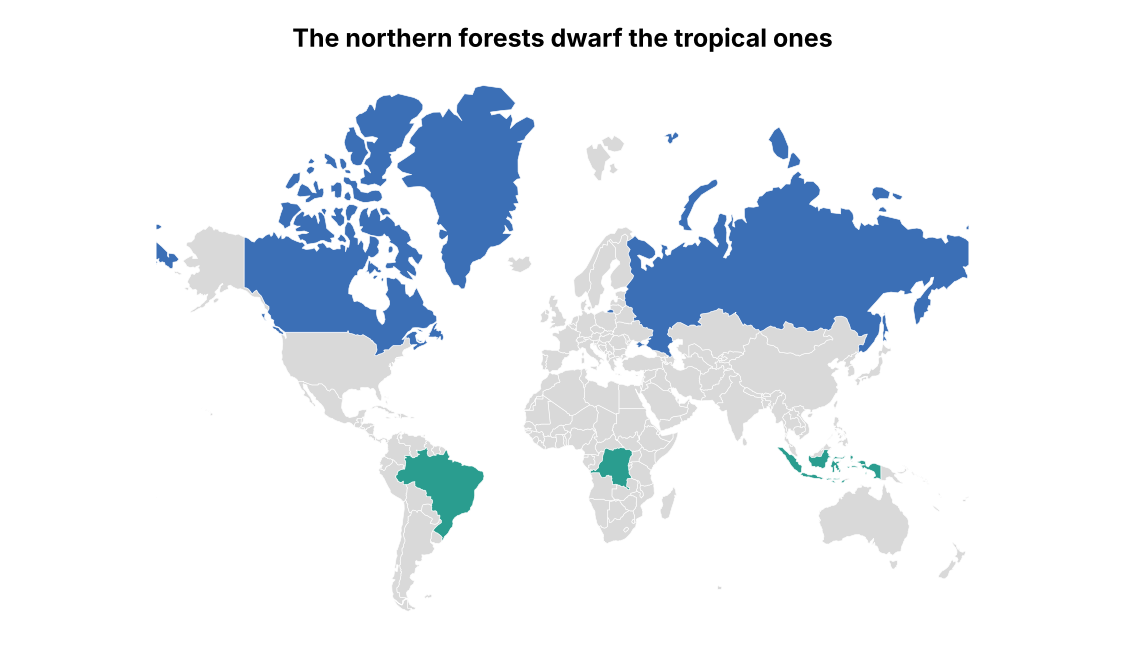
Choropleths, colour scales and projections that distort.